
MI–0019 Recorded September 10, 2026
Ask: relative to what?
A percentage is incomplete until you know what it is a percentage of.


The rabbit box
Imagine 100 rabbits. Put two of them in a box.
Before
2 out of 1002% of all the rabbits are in the box.
After one rabbit is added
3 out of 1003% of all the rabbits are in the box.
What changed? One rabbit was added to the group of 100. The proportion rose from 2% to 3%.
The 50% is not false. It simply uses the two rabbits already in the box as its denominator. The one-percentage-point figure uses the full group of 100 as the frame.
The marketing is in the type size

The arithmetic is exact apart from ordinary headline rounding. An outcome rising from 3% to 4% improves by one percentage point in absolute terms. Compared with the 3% starting rate, that one-point gain is 33⅓% relatively—reasonably shortened to 33% in a headline.
Now notice how the presentation does the marketing. “33% improvement in outcomes” is enormous and glamorous. “Relative improvement” is much smaller. The figures most useful for judging the real-world change—3% to 4%—are relegated to the fine print.
Beware: the largest number is often the number chosen to sell. The smallest print may contain the numbers needed to decide.
“Absolute” does not mean denominator-free
Tim noticed a genuine language trap: both figures are comparisons. Two percent means two relative to 100. A one-percentage-point increase means one relative to the same population of 100. A 50% increase means the extra one relative to the original two.
In risk communication, absolute risk is the conventional name for the event rate in a defined group and time period. Absolute risk difference is the subtraction between two event rates. Relative risk divides one event rate by the other.
“Absolute” does not mean the number exists without context. It means the original scale has been kept visible.
The denominator is where the meaning lives

“Risk fell by 50%” leaves out the starting risk. If the risk fell from 40% to 20%, the absolute reduction is 20 percentage points. If it fell from 2% to 1%, the absolute reduction is one percentage point. If it fell from 0.02% to 0.01%, the absolute reduction is 0.01 percentage point.
| Without the intervention | With the intervention | Relative reduction | Absolute reduction |
|---|---|---|---|
| 40% | 20% | 50% | 20 percentage points |
| 2% | 1% | 50% | 1 percentage point |
| 0.02% | 0.01% | 50% | 0.01 percentage point |
If you know the result without the intervention, the result with the intervention and the absolute reduction, you have the essential numbers needed to understand the size of the benefit. Most people can also estimate the rough relative reduction from those figures if they want it.
Marketing commonly reverses that sensible hierarchy: the relative reduction is made prominent while the starting rate, ending rate and absolute reduction become secondary or disappear. Clear and honest communication should highlight the three concrete figures and treat the relative reduction as, at most, supporting information.
For an individual trying to understand the size of an effect, a relative reduction given greater prominence than the underlying rates is misleading. This table shows why: the same impressive 50% can mean 20 percentage points, one percentage point or one-hundredth of a percentage point.
Those figures explain the numerical benefit. A complete personal decision may still require the time period, outcome severity, possible harms, cost, evidence quality and individual circumstances.
The example that proved the point by failing
Tim wanted to help his wife, Sonja, think about the possible benefit of a particular medicine. Before they could discuss whether the benefit was worthwhile, they needed a shared way to think about risk tolerance.
Sonja provided the perfect example. She happily crosses the United States on long solo trips in her van. It has the whole setup: a bed, a tiny kitchen, a microwave and even a portable loo. She is comfortable accepting the extra uncertainty of a long journey because she values the freedom and adventure.
With GPT, Tim made an illustration using figures from an earlier illustrative risk model: an 8.5% estimated annual risk for normal local travel and an 11% estimated annual risk for Sonja’s long-distance travel. The same modeled change can be stated in two ways:
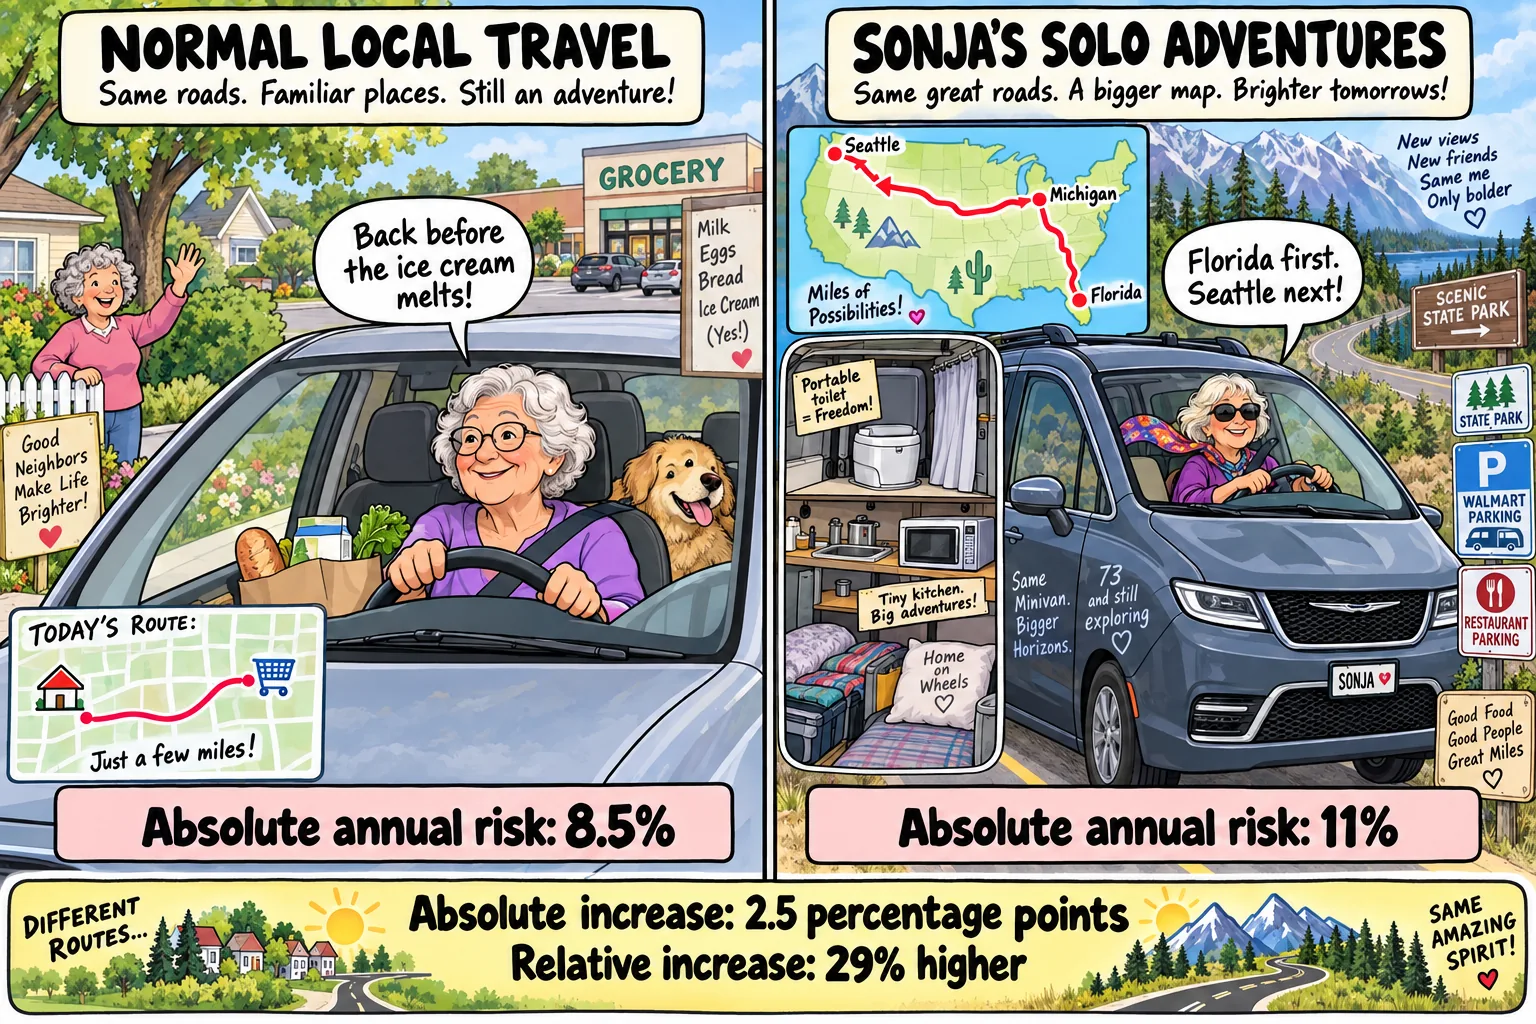
Then came the revealing moment. Sonja looked at the image and immediately focused on the relative figure: It’s almost 30% more dangerous for me driving across the country than it is when I go to the store and drive locally. I don’t believe it’s that big. No way.
The 29% did not merely look larger. It became the story. Sonja’s attention went straight to it, her emotional reaction followed it, and the 2.5-percentage-point change almost disappeared. Yet the 29% was simply another expression of the move from 8.5% to 11%. Tim regarded the underlying change as fairly modest in the scheme of things; Sonja was free to judge it differently. The important point was to see both descriptions before deciding.
The demonstration worked because it failed: even after the distinction had been explained, the larger number captured the whole emotional response and pushed everything else into the background.
A highly scientific footnote: Sharp-eyed readers may notice that the dog in the “normal local travel” panel has three eyes. The author therefore suspects that local driving may carry the greater risk—of mutation, at least.
A casino reverses the frame
Imagine a casino offering a bet with a 2% chance of losing—or, framed the other way, a 98% chance of winning. Would you make the bet ten times? Now raise the chance of losing to 3%, leaving a 97% chance of winning. That may still feel like excellent odds.
Then change only the description: your risk of losing is 50% higher. The loss probability has moved from 2% to 3%—an increase of one percentage point—but the relative figure may suddenly make the same bet feel alarming.
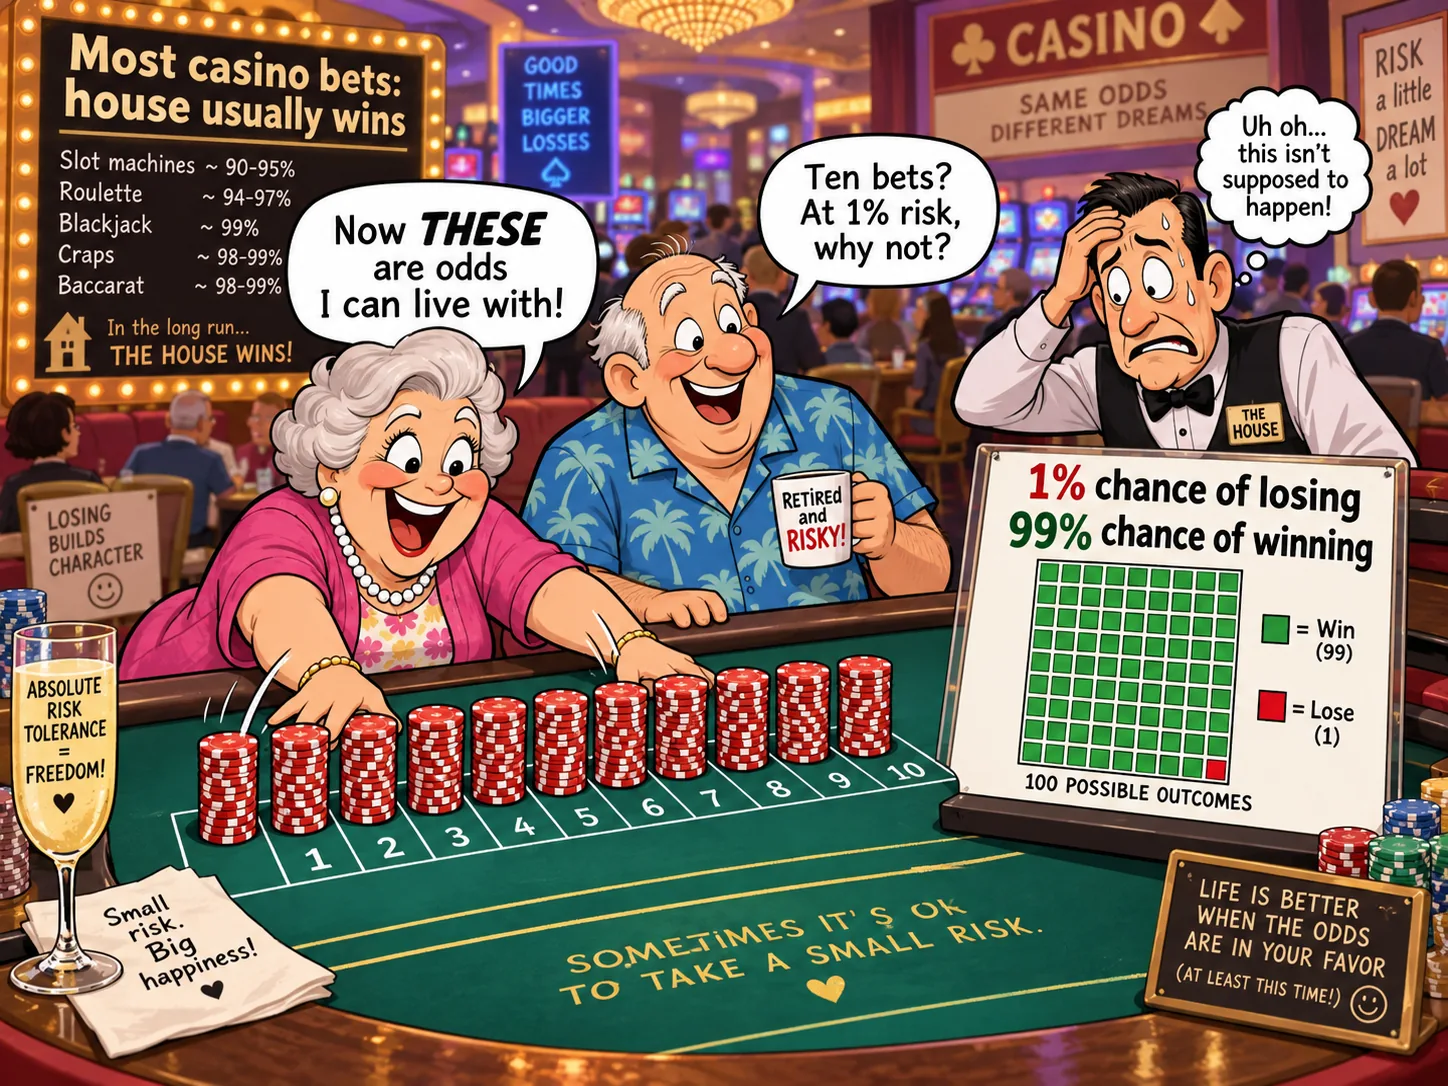
The effect becomes even more dramatic when the chance of losing rises from 1% to 2%:
Crucial correction: “100% higher risk of losing” does not mean a 100% probability of losing. The chance of losing the next bet is still 2%, and the chance of winning it is still 98%.
Ten successive bets do change the arithmetic because the opportunities to lose accumulate. Assuming each bet is independent, the chance of losing at least once is:
| Loss chance on each bet | Win chance on each bet | Chance of at least one loss in ten bets |
|---|---|---|
| 1% | 99% | About 9.6% |
| 2% | 98% | About 18.3% |
| 3% | 97% | About 26.3% |
Across ten bets, moving from a 2% to a 3% loss chance per bet raises the chance of at least one loss by about 8 percentage points—from 18.3% to 26.3%—or about 44% in relative terms. Moving from 1% to 2% raises it by about 8.7 percentage points—from 9.6% to 18.3%—or about 91% relatively.
The decision still cannot be made from probability alone. The amount won, the amount lost, whether the bets are independent and whether one loss is tolerable all matter. But the thought experiment exposes the central problem: the emotional meaning can reverse when nothing changes except the frame.
A medical example: statins
A large individual-participant meta-analysis by the Cholesterol Treatment Trialists’ Collaboration reported that each 1 mmol/L reduction in LDL cholesterol with statin therapy reduced major vascular events by about 21% proportionally. That is a relative reduction. The absolute benefit was larger for people whose starting cardiovascular risk was higher.
Here is a deliberately simplified illustration using the same approximate 21% proportional reduction in two different groups. These are teaching numbers, not predictions for a particular patient:
Higher starting risk
100 → 79 events per 1,000About 21 fewer events per 1,000 people.
Lower starting risk
20 → about 16 events per 1,000About 4 fewer events per 1,000 people.
Both examples use roughly the same relative effect. They do not offer the same absolute benefit. That is why “statins reduce risk by about one fifth” is incomplete when discussing what one person is likely to gain.
The effectiveness of a treatment and the amount one person stands to benefit are related questions—not identical ones.
Good medicine needs both views
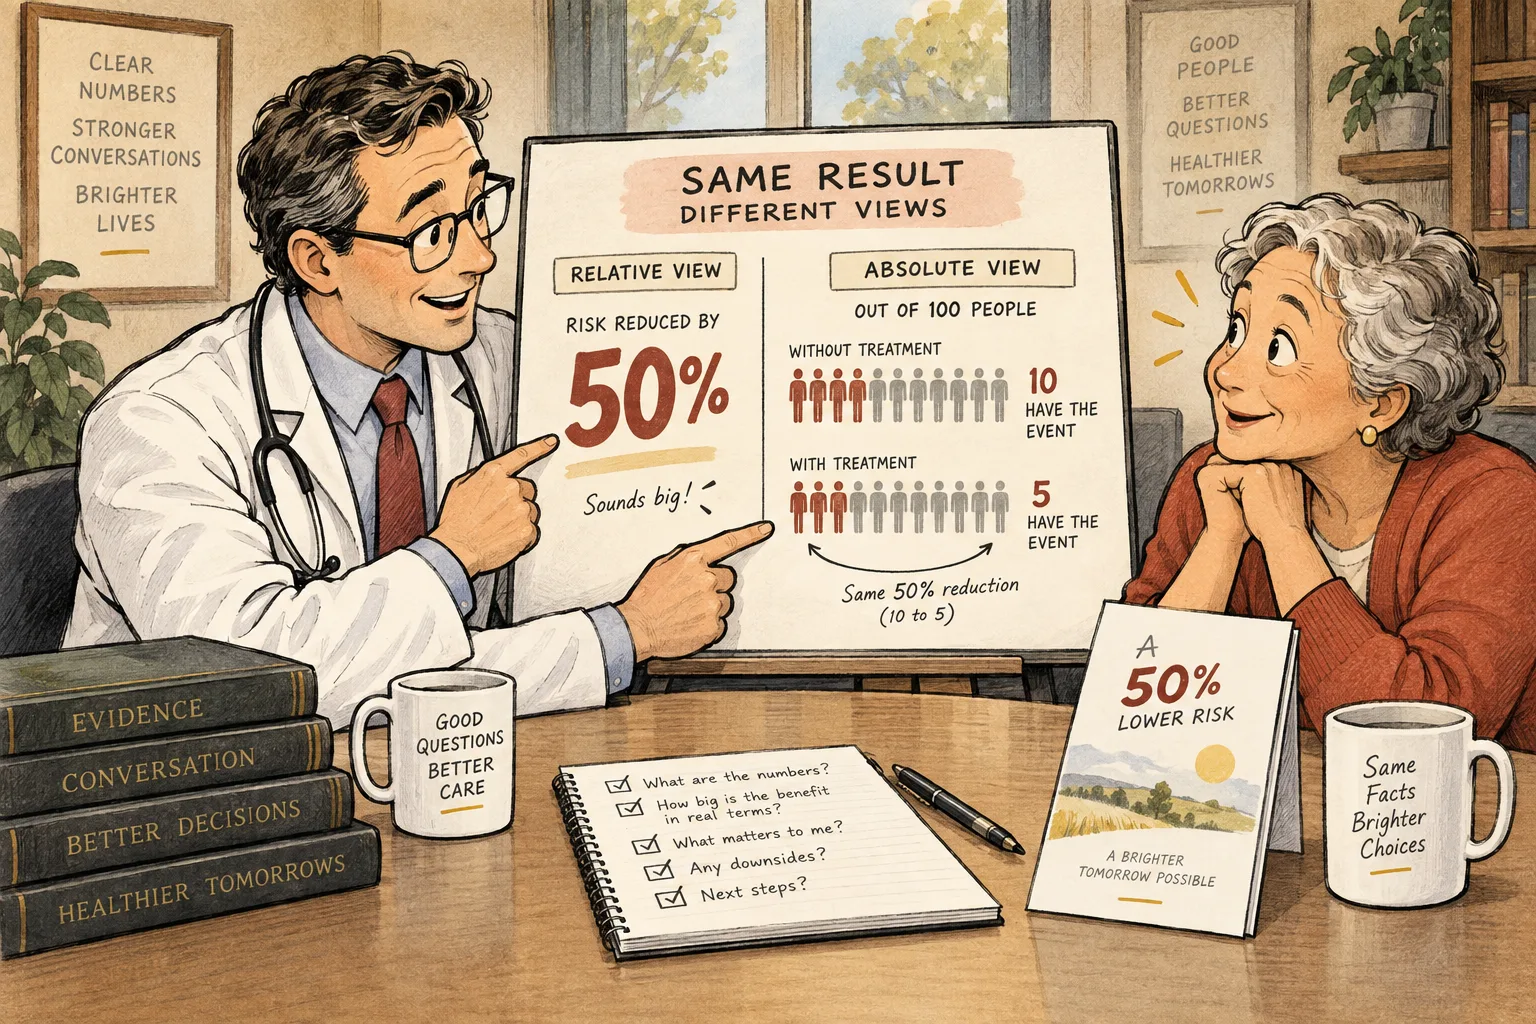
Relative risk is not a trick by definition. Researchers use it because proportional effects can be useful for comparing groups and combining evidence across studies. It often describes how strongly an intervention is associated with an outcome.
Absolute risk is essential for personal decisions because it incorporates the starting probability. Age, existing disease, smoking, blood pressure, cholesterol, diabetes, treatment duration and the exact outcome being counted can materially change that starting risk.
The result must also specify the time period. A 1% change over one year is not the same proposition as a 1% change over ten years.
Why the larger-sounding number gets repeated
Relative figures are useful in scientific analysis. Drug marketing, however, is aimed largely at ordinary people—not statisticians who instinctively reconstruct the starting rate, ending rate, denominator and time period.
Imagine an expensive drug that changes a desired outcome from 2% to 3%. Most people deciding whether to buy or request it want to know those two rates: the improvement is one percentage point. “50% more effective” describes the same calculation, but creates a radically larger impression. A change from 3% to 5% is two percentage points, but can be advertised as about 67% more effective.
Sonja’s reaction shows why this is such an effective marketing tool. The largest number jumps out, becomes the headline and shapes the emotional meaning of everything that follows. The smaller starting and ending numbers may still be printed somewhere, but they are easily ignored once the relative figure has seized attention.
When billions of dollars in sales can depend on whether a benefit feels substantial, the choice of frame can be enormously valuable. Sophisticated companies test messages, study consumer response and know which presentation produces the stronger impression.
The author’s view: When a company leads the public with “50% more effective” while withholding, obscuring or burying “2% to 3%,” it is misleading the public. The arithmetic may be correct. The communication is not honest enough for the decision people are being asked to make.
The deception does not require a false number. It can consist of selecting one true number precisely because ordinary buyers will mistake it for a much larger real-world benefit, while making the numbers they actually need much harder to notice.
This criticism is specific. It does not mean every use of relative risk is deceptive, every treatment is ineffective or every company communication is dishonest. It means that prominently marketing a relative benefit without giving the absolute change equal clarity is misleading—even when the relative calculation itself is perfectly accurate.
When the marketing frame reaches the consulting room
Tim and Sonja found something still more troubling in their own medical conversations. Doctors and nurse practitioners discussed drug benefits using the relative figure without volunteering the absolute starting and ending rates. When Tim challenged the presentation and asked about the absolute benefit, several did not appear to understand the distinction he was making.
That removes an important safeguard. A patient might reasonably expect a clinician to translate a promotional-sounding percentage into, “Out of 100 people like you, this many benefit without the drug and this many with it.” If the clinician simply repeats the relative figure, the patient receives the same amplified impression with the added authority of a medical professional.
The author’s interpretation: The relative-benefit message is so pervasive that some medical staff appear to have been conditioned by it too. Tim describes that more bluntly as “brainwashed”: the framing has been repeated so often that it is passed on as the obvious way to describe benefit, without its practical meaning being examined.
This personal experience cannot establish how common the problem is throughout medicine or determine whether company materials, research abstracts, professional education, guidelines, time pressure or habitual shorthand produced any particular clinician’s framing. It does show that the problem did not stop with consumer advertising in these encounters.
Experiments have also found that presenting identical treatment effects as relative reductions can make them appear more impressive to clinicians than presenting them as absolute reductions or numbers needed to treat. The vulnerability to framing is therefore not confined to scientifically untrained patients.
The five questions that rescue a percentage
- Relative to what? What is the denominator?
- What was the starting risk? Give me the event rate without the intervention.
- What was the ending risk? Give me the event rate with the intervention.
- Over what period? One year, five years, ten years or a lifetime?
- What happened to actual people? Out of 100 or 1,000 similar people, how many experienced the outcome in each group?
Then ask about harms in the same format. Benefits shown as relative percentages and harms shown as absolute percentages create an unfair comparison.
Never accept “50% better” or “50% worse” as a complete statement. Ask to see the two actual numbers.
Evidence, interpretation and boundaries
Sources and limitations
The rabbit examples, the 3%-to-4% advertisement, the three 50% examples and the casino probabilities are arithmetic demonstrations. The advertisement rounds 33⅓% to 33%. The casino calculations assume ten independent bets and count the chance of at least one loss; actual gambling decisions also depend on payouts, stakes and house advantage. The Sonja travel figures reproduce an earlier illustrative model; their source and assumptions are not established here, so they must not be treated as observed accident rates or a personal risk estimate. The statin figures are a simplified application of the approximate proportional effect reported by the Cholesterol Treatment Trialists’ Collaboration; individual benefit cannot be inferred from them.
The cited framing research supports the claim that presentation format changes perceived effectiveness. The stronger judgment—that companies knowingly mislead when they prominently market a relative benefit while burying its absolute change—is the author’s interpretation of those incentives and communication choices, not a finding about a named company in the cited studies. Tim and Sonja’s clinician encounters are personal experience; the “brainwashed” description is Tim’s interpretation, not evidence of how prevalent the problem is across medicine. The FDA emphasizes communicating both benefits and risks clearly so patients can make informed decisions with health professionals.
One final warning
